
by Aarti Sahasranaman, Vice President, Interventions
One of the key functions of ICTPH’s Health Management Information System (HMIS) is to collect health information and maintain electronic medical records (EMRs) of each patient who visits a SughaVazhvu rural micro health centre (RMHC) (Rajanna & Kapila, 2011 1). These EMRs serve important roles at the levels of the individual and of the population. At the level of the individual, EMRs chronicle the health status of each person, making it possible for the physician to view the entire medical history of that person at one go. Access to such comprehensive information enables the physician to make better and more thoughtful decisions about the kind of care that the patient should receive. At the population-level, data from EMRs provides the basis for epidemiological analyses of the communities served by our RMHCs. Such epidemiological analyses become especially important when viewed through the lens of the preventive-promotive approach to healthcare taken by ICTPH. For example, if an analysis of data from the HMIS suggests that there is a high proportion of hypertensives within the catchment area served by one of our RMHCs, it signals to us that there is a need for greater awareness on prevention for hypertension in this community. These data can also measure indicators that will help us determine the efficiency of our processes, and tweak these processes if they are found to be sub-optimal. Furthermore, data from EMRs will also make it possible to measure the impact of our protocols on the health of our populations. Such impact evaluation is necessary to demonstrate the success of our model of primary care delivery through RMHCs situated within rural communities. It is important to remember that for such kinds of analyses to be performed, it is absolutely necessary that we have high quality healthcare data, at the most granular level. In order to validate the HMIS as a tool that can collect such granular data and provide meaningful epidemiological information, I performed a preliminary analysis of the most common chief complaints presented by patients across five of our RMHCs (Alakkudi, Karambayam, Andipatti, Kavarapattu, and Okkanadu Melaiyur) in the six-month period between October 15th, 2011 and April 15th, 2012. The chief complaints were analysed by age of the patient. I also performed a similar analysis of the most common diagnoses made by physicians across these RMHCs.
A quick analysis of chief complaints across all RMHCs in the above mentioned six-month time frame revealed that the five most common chief complaints that patients presented with, in decreasing order of frequency, were-
- Cold
- Body Pain
- Multiple Joint Pain
- Weakness
- Infected Wound
While this list gives us a general ideal of the most common complaints, it is likely that this list does not present the entire picture. Since health complaints are closely associated with the age of patients, I decided to look at how chief complaints varied with age.
It is obvious from the above list that a complaint of cold is likely to be symptomatic of an acute episode such as laryngitis or pharyngitis, whereas complaints such as body pain, multiple joint pain, and weakness are likely to signify chronic conditions such as myalgia or osteoarthritis. Given that conditions such as osteoarthritis occur due to aging and normal wear and tear of the joints, it follows that patients presenting with complaints symptomatic of this condition will be elderly. Therefore, it is possible to extend this premise and hypothesise that the proportion of patients presenting with so-called “chronic complaints” like body pain and joint pain will be higher, as patients get older. To test this hypothesis, I analysed the most common chief complaints of patients belonging to different age groups. Patients were categorised into one of seven age groups – 0 – 4y (infants), 5 – 9y (young children), 10 – 18y (adolescents), 19 – 29y, 30 – 49y, 50 – 69y, >=70y. Chief complaints were then placed in four categories:
- Acute – Includes complaints such as cold, cough, running nose, fever, itching skin, sore throat, stomach ache, and diarrhoea.
- Chronic – Body pain, back pain, multiple joint pain, weakness.
- Injuries/Wounds – Infected wounds and accidental injuries.
- Others – All vision and oral health-related complaints.
Where chief complaint was “not mentioned”, data was excluded from analysis. “Not mentioned” usually (but not always) indicates that the patient was visiting to avail of the CVD voucher entitling him/her to a free lipid profile and blood glucose test.
Figure 1 below details the proportion of each of the above four categories of chief complaints in patients belonging to each age group. In this bar graph, the length of each bar corresponds to the absolute (total) number of visits made by patients belonging to that age group. Therefore, this graph captures both the total number of visits made by patients belonging to each age group, and the proportion of acute, chronic, injuries/wounds, and other complaints with which patients in each of these groups presented.
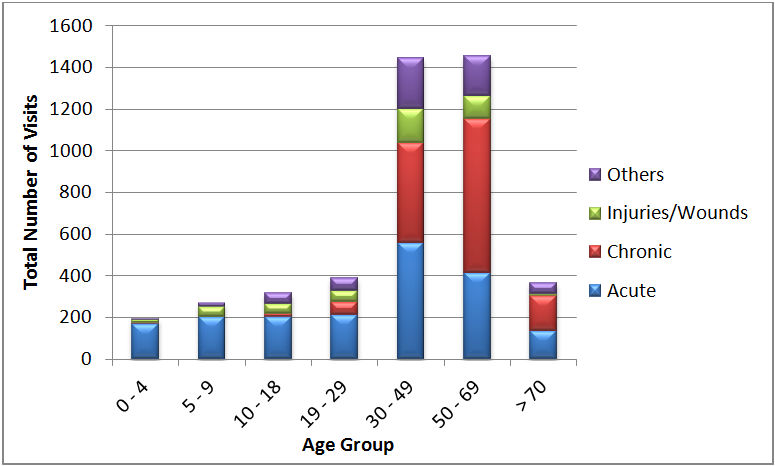
Figure 1. Proportion of different chief complaints in each age group shown as a function of the total number of visits made by individuals in each age group.
Three observations can be made from figure 1 above. The first is that most patients visiting our RMHCs belong to the 30 – 69y age group, as indicated by the lengths of the bars corresponding to 30 – 49y and 50 – 69y age groups. Secondly, a high proportion of those in the 30 – 49, 50 – 69y, and >=70y age groups appear to be presenting with chronic complaints, with chronic complaints outnumbering acute complaints by almost two-fold in the two oldest age groups. Finally, the absolute number of acute complaints in the older age groups is still higher than the absolute number of acute complaints among the younger patient population.
While figure 1 shows the greater prevalence of chronic complaints amongst older patients, it does not fully reveal the proportion of various kinds of chief complaints for each age group, and how this proportion changes as the population ages. Figure 2 shows the proportion of acute, chronic, injuries/wounds and other chief complaints for patients belonging to each group. Here, the total number of patient visits is no longer considered, as a result of which each bar is equal in length, representing 100% of all patient visits in that age group.
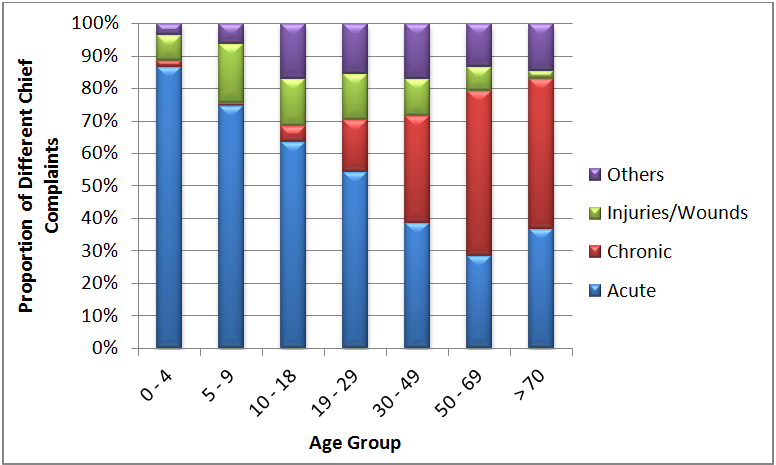
Figure 2. Proportion of different chief complaints in each age group.
Figure 2 clearly reveals that acute complaints constitute the largest burden among patients up to the age of 18 years, with injuries and wounds also contributing significantly. However, the proportion of acute complaints reduces as the patient population ages, with only a slight rise in the >=70y age group. As the proportion of acute complaints reduces with increasing patient age, there is a concomitant increase in the proportion of chronic complaints. These data support our hypothesis that the proportion of chronic complaints increases as the patient population ages. Not surprisingly, we see similar effects when patients belonging to different age groups are also segregated by sex (data not shown).
At a more granular level, the raw data (not shown) reveal that starting from the 19 – 29y age group, body pain appears as a moderately frequent chief complaint. Since most of the population in our catchment areas is involved in cultivation, and this is the age at which young people start working more regularly in the fields, it comes as no surprise that body pain is a common complaint. And the prevalence of body pain increases in the 30 – 49y age group, at which point multiple joint pain also starts appearing as a chief complaint. By the time we reach the 50 – 69y patient population, multiple joint pain outnumbers body pain as the most common chronic complaint. Once again, this is to be expected as joint problems crop up as an individual grows older.
Since chief complaints and diagnoses closely parallel each other, I also looked at the most common diagnoses made across RMHCs in the six-month period between October 15th, 2011 and April 15th, 2012. The five most common diagnoses were:
- Pharyngitis
- Allergic Bronchitis
- Osteoarthritis
- Myalgia
- Acid Peptic Disease
These diagnoses mostly parallel the common chief complaints, but for reasons described above, I also analysed the most common diagnoses in patients of different age groups. The hypothesis here is that the diagnosis of chronic conditions will increase as the patient population ages. This analysis was done in a manner similar to that described above for the chief complaints. Diagnoses were placed in four different categories:
- Acute – Conditions such as laryngitis, pharyngitis, bronchitis, acid peptic disease, gastroenteritis, sinusitis, reproductive tract infections such as cervicitis and vaginitis, tonsillitis etc.
- Chronic – Hypertension, Diabetes Mellitus, hyperlipidaemia, myalgia, back ache, osteoarthritis, spondylosis – cervical/lumbar, and cervical abnormalities (VIA/VILI positive).
- Injuries/Wounds
- Others – Vision problems such as cataract and conjunctivitis, otitis media, gum and tooth problems.
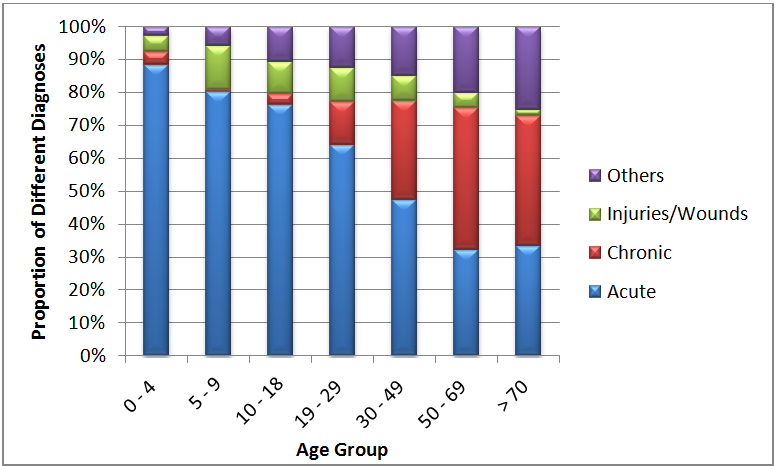
Figure 3. Proportion of different diagnoses in each age group.
As can be seen in Figure 3 above, the proportion of chronic conditions diagnosed increases as the patient population ages, while the number of acute episodes decreases. However, the number of patients diagnosed with an acute condition still outnumber those diagnosed with a chronic condition right up to the 30 – 49y age group. It is also important to keep in mind that a single patient can be diagnosed with multiple conditions, both acute and chronic. Interestingly, the proportion of “other” diagnoses made also increases, with “other” contributing a significant burden in the above 70y age group. This increase in the proportion of diagnosis of chronic conditions as the patient population ages justifies our approach of pro-active preventive healthcare, and is a reminder that we must continue this focus to achieve optimal health outcomes for our communities.
Since the proportion of chronic conditions appears to increase with aging of the patient population, I then looked more carefully at the various chronic conditions that patients were diagnosed with, to understand if the proportion of individual chronic conditions also varied with age.
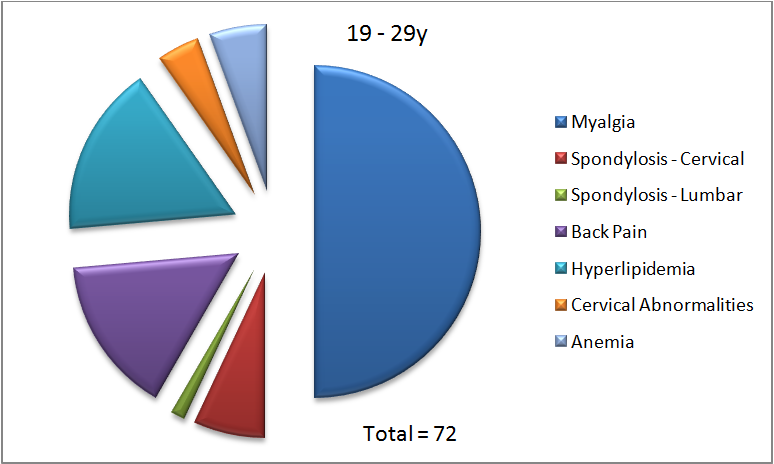
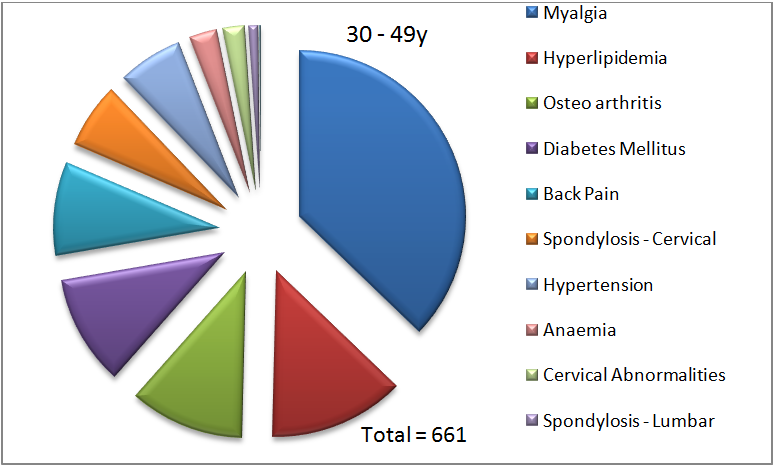
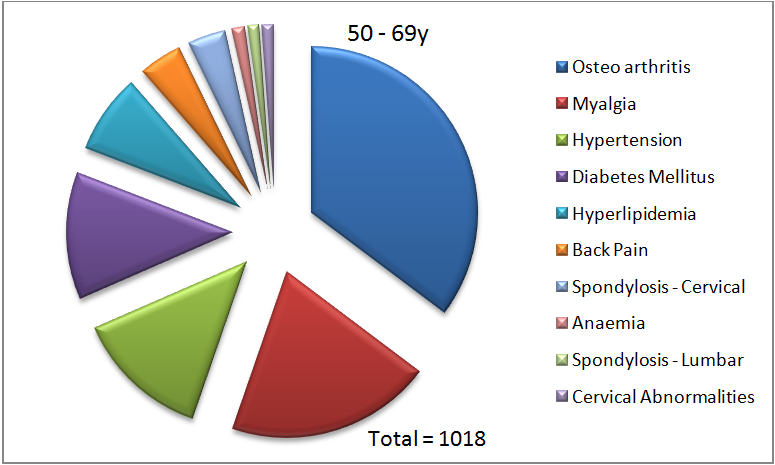
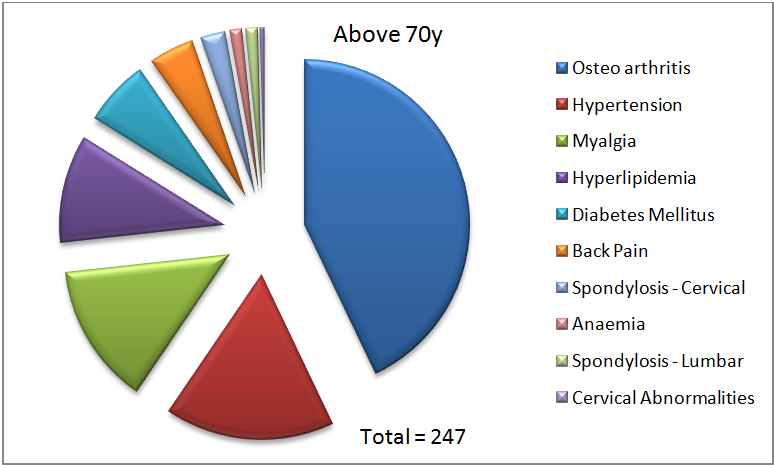
Figure 4. Proportion of diagnoses of various chronic conditions in each indicated age group.
In each panel in figure 4, the total number represents the number of chronic conditions diagnosed in that age group. In the 19 – 29y age group, myalgia represents 50% of all chronic diagnoses made. As can also be seen, only seven of the ten possible chronic conditions are diagnosed in this age group. There are no diagnoses of hypertension, diabetes or osteoarthritis in this age group. This is not entirely surprising since age is a filtering criterion for screening for diabetes, and these younger individuals might not have undergone a blood glucose test due to the absence of other risk factors. As mentioned before, osteoarthritis is also caused due to aging, and it, therefore, makes sense that we do not see this diagnosis being made in the 19 – 29y age group.
In the 30 – 49y age group, we already observe that more different kinds of chronic conditions are being diagnosed. We see that there are ten conditions that are now diagnosed, with myalgia being the most common at 37%. Hyperlipidemia (13%) and osteoarthritis (11%) are the next most common diagnoses. In the 50 – 69y age group, we see that myalgia is no longer the top diagnosis. It is replaced by osteoarthritis (35%), followed by myalgia (20%), and hypertension (14%). Finally, in the above 70y age group, osteoarthritis is the most common chronic condition diagnosed (43%), followed by hypertension (17%), and myalgia (14%).
As mentioned above, an interesting observation from figure 3 is the increase in the proportion of “other” diagnoses as the population ages. In looking carefully at the various conditions in this category, it became apparent that cataract contributed a huge burden to this group of diagnoses (data not shown), and the contribution of cataract increased with age of the patient population (Figure 5).
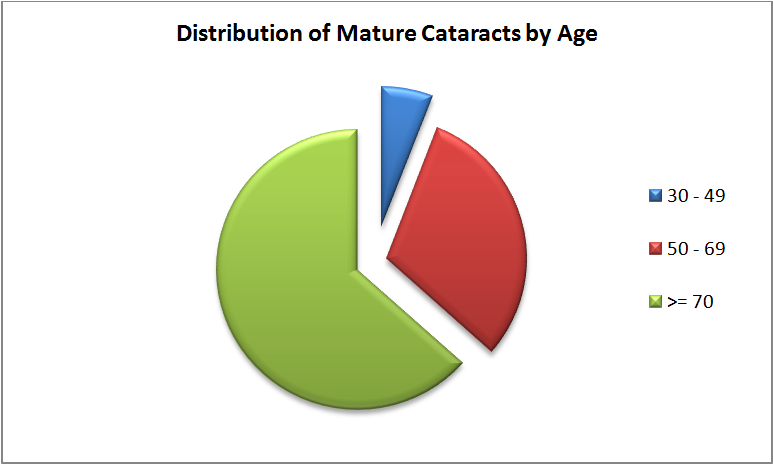
Figure 5. Contribution of cataract to all diagnoses increases with age of patient population.
In the 30 – 49y age group, mature cataract represents 1.4% of all diagnoses, and 9.1% of “other” conditions. This number increases in the 50 – 69y age group, with mature cataract contributing 7.3% to all diagnoses, and 36.6% to all “other” conditions. Finally, in the above 70y age group, mature cataract represents 15.1% of all diagnoses, and 60.1% of all “other” conditions diagnosed. These data are consistent with the fact that cataract is a common problem in the elderly. Since cataract is also one of the leading causes of preventable blindness, these data point to the need for us to establish a referral pathway to enable such patients to get treated before it is too late.
The results of the above analyses of chief complaints and diagnoses of patients visiting our RMHCs is consistent with our expectations and with the emerging understanding that non-communicable diseases contribute a huge burden to the disease profile in low- and middle-income countries. These results also underscore the validity of the HMIS as a tool to collect data that can be used to perform epidemiological analyses. From a research standpoint, such analyses will help us understand the health status of our communities better, and therefore, make more refined predictions about the health of individuals and populations, as a whole. From our standpoint as healthcare providers, such analyses will enable us to determine the kinds of interventions required for specific segments of the population so that our limited resources are optimally employed. In the near future, I also plan to closely look at the data from each intervention to get a better understanding of how efficiently our processes as they relate to each intervention are functioning. Performing such process evaluations will help us get a clearer understanding of what we are doing well, and where we need to pay more attention, so that we can achieve the desired health outcomes for our populations.
1Rajanna, D., & Kapila, S. (2011). IKP Centre for Technologies in Public Health. Retrieved May 4, 2012, from http://ictph.org.in/downloads/HMIS-TechnicalNote.pdf

Leave a Reply
Be the First to Comment!